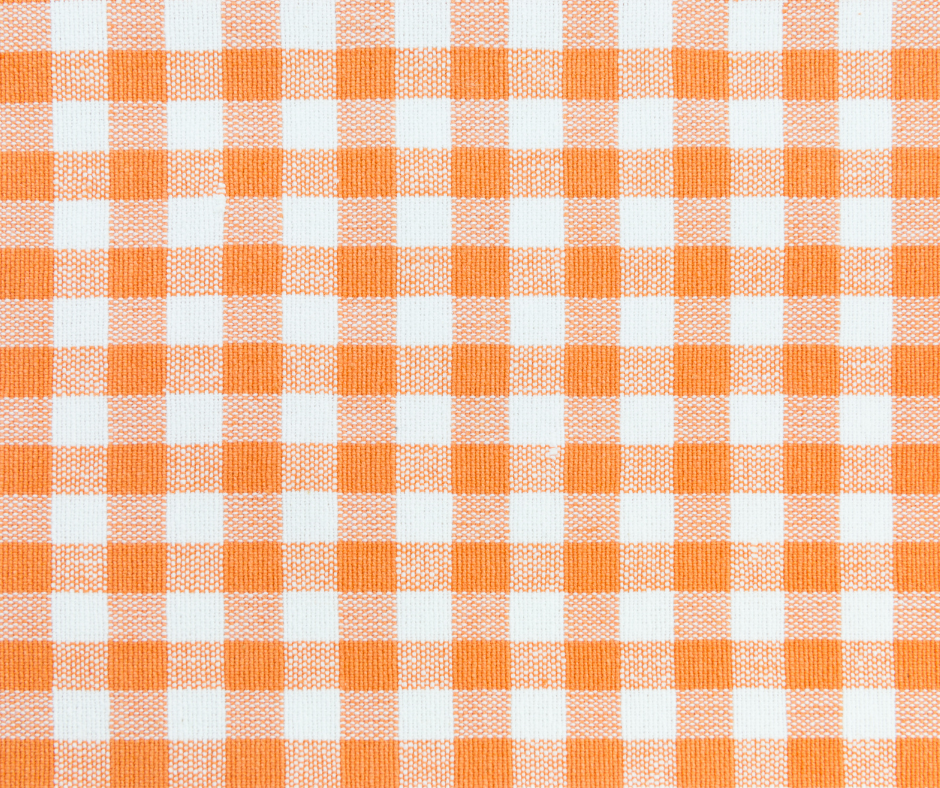
Click on the images to
select measurement points for color analysis
Selected:
0 / 5
Reference Image
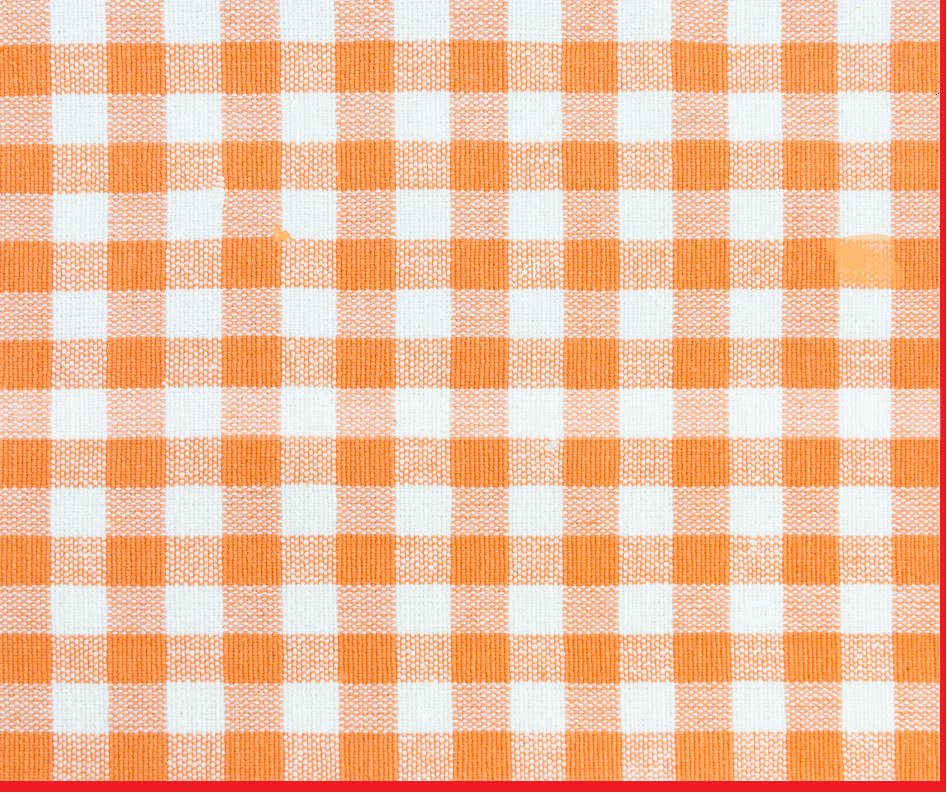
Sample Image
Click anywhere on either image to place a sample point. Points are
mirrored on both images.
Analysis Configuration
Fine-tune quality control parameters
Operator Information
Details shown on the generated report.
Name of the person conducting analysis
Hours to adjust report timestamp
Language used in generated PDF reports
English
Türkçe
Image Alignment Mode
Select preprocessing technique for image alignment before comparison analysis.
Choose how images are aligned before pixel comparison
Test and compare techniques visually before applying
Selection Region
Define the shape and dimensions of the analysis region.
Select the shape for region selection
Specify region size in pixels
Click and drag on the image to draw a freehand region
Single Image Configuration
Configure analysis implementation for Single Image Mode.
Sampling Configuration
Points to measure
Selected: 0 / 5Incomplete
Manual0
Random0
Add Point by Coordinates
Entered Points
No coordinate points added yet.
Report Sections
Select sections to include in the Single Image report.
Color Scoring Method
Select which metric determines the Color Score, Pass/Conditional/Fail decision, and report cover display.
Determines the primary color score
Thresholds (ΔE00)
Define pass/fail criteria for color difference.
Values below this are accepted
Values below this are warning (if above pass)
Overall image color score threshold
CSI Thresholds
CSI uses full-image pixel-by-pixel ΔE₀₀ across the reference and sample images.
Lab* Thresholds
Define component-level thresholds for Lab* quality assessment.
Lightness tolerance
Red-green axis tolerance
Yellow-blue axis tolerance
Combined ?Lab vector magnitude
Sampling Configuration
Configure how analysis points are selected for Color
Analysis.
Target number of points (max 100)
Selected: 0 / 5Incomplete
Manual 0
Random 0
Add Point by Coordinates
Entered Points
No coordinate points added yet.
Pattern Scoring Method
Select which metric determines the Pattern Score on the report cover and UI.
Determines the primary pattern score
Method Thresholds (Pass / Conditional)
Define per-method thresholds for pattern analysis. SSIM uses raw 0-1 values.
Pass /
Conditional
Pass /
Conditional
Pass /
Conditional
Pass /
Conditional
Overall pass
threshold
Difference Sensitivity (1 - 10)
Controls how aggressively the difference map amplifies subtle variations. Higher values reveal finer differences; lower values suppress noise.
1 = strict, 10 = permissive
7
1 = strict, 10 = permissive
7
Boundary Extraction Sensitivity (1 - 10)
Controls how aggressively boundary contours are extracted from the difference map. Higher values detect more subtle boundary regions; lower values show only obvious defects.
1 = strict, 10 = permissive
4
1 = strict, 10 = permissive
8
Structural Sensitivity (1 - 10)
Controls how aggressively the multi-method structural difference pipeline detects changes. Higher values flag subtle variations; lower values only flag obvious defects.
1 = strict, 10 = permissive
10
Global Report Illuminant
Select the primary illuminant used for the entire report.
Used for standard calculations
Illuminant Test Selection
Enable illuminants for comparative color testing (displayed in
Color Unit only).
Color Unit Report Sections
Select components for the Color Unit section.
Pattern Unit: Enabled Methods
Select which pattern algorithms to run and include.
Pattern Unit: Boundary & Report
Format Information
Website Under Development
This website is currently under
development.
You can view the results
through
the ready-made samples from the Samples section on the left side of the screen.
Or, to test new samples, download
the
source code (Python) and test it directly in the Google Colab environment.
To obtain full results,
these logos must be added to Google Colab with the same filenames.
Source Code
Copy
the
code and paste it into the Google Colab environment.